Maak in één middag een compleet duurzaamheidsverslag voor jouw MKB-bedrijf
Bereken je uitstoot automatisch, verzamel alle ESG-gegevens en maak een compleet VSME-rapport. Klaar voor aanbestedingen, ketenverzoeken, of gewoon voor een betere wereld.
Geen betaalgegevens vereist
Eerst met ons praten? Boek een demo
Van de mkb bedrijven krijgt de komende jaren een ESG-verzoek
Van de aanbestedingen wordt nu al gegund op duurzaamheid
Voldoe moeiteloos aan de belangrijkste eisen


Eén overzichtelijke en gebruiksvriendelijke plek voor al je CO2-cijfers, VSME-rapport en ESG-data
Uitstoot berekenen
✓ Upload je energierekeningen of voer je verbruik in
✓ Automatisch je CO2 per scope, categorie en locatie
✓ Zie in één oogopslag waar de meeste uitstoot zit
VSME-rapport zonder gedoe
✓ Geen eigen Excel-modellen of zoeken in wetteksten
✓ Zie wat nog ontbreekt en krijg voorbeelden
✓ Download je rapport (bekijk voorbeeld) direct in PDF of Excel voor klanten of aanbestedingen
Doelen stellen en dashboards
✓ Dashboards die iedereen begrijpt, meteen deelbaar
✓ Praktische verbetertips op basis van je eigen data
✓ Stuur gericht bij en vergroot de kans dat je doelen ook écht worden gehaald
Zie wat Greenreporting voor jou kan betekenen

Voor mkb’ers
Klaar voor aanbestedingen, ketenverzoeken en rapportage op één plek.

Voor adviseurs
Bouw betrouwbare rapporten en beheer meerdere klanten in één dashboard.
Besparing in uren met Greenreporting - tot wel 12 dagen per jaar
Bedrijven gebruikten Greenreporting al voor het maken van een VSME rapport
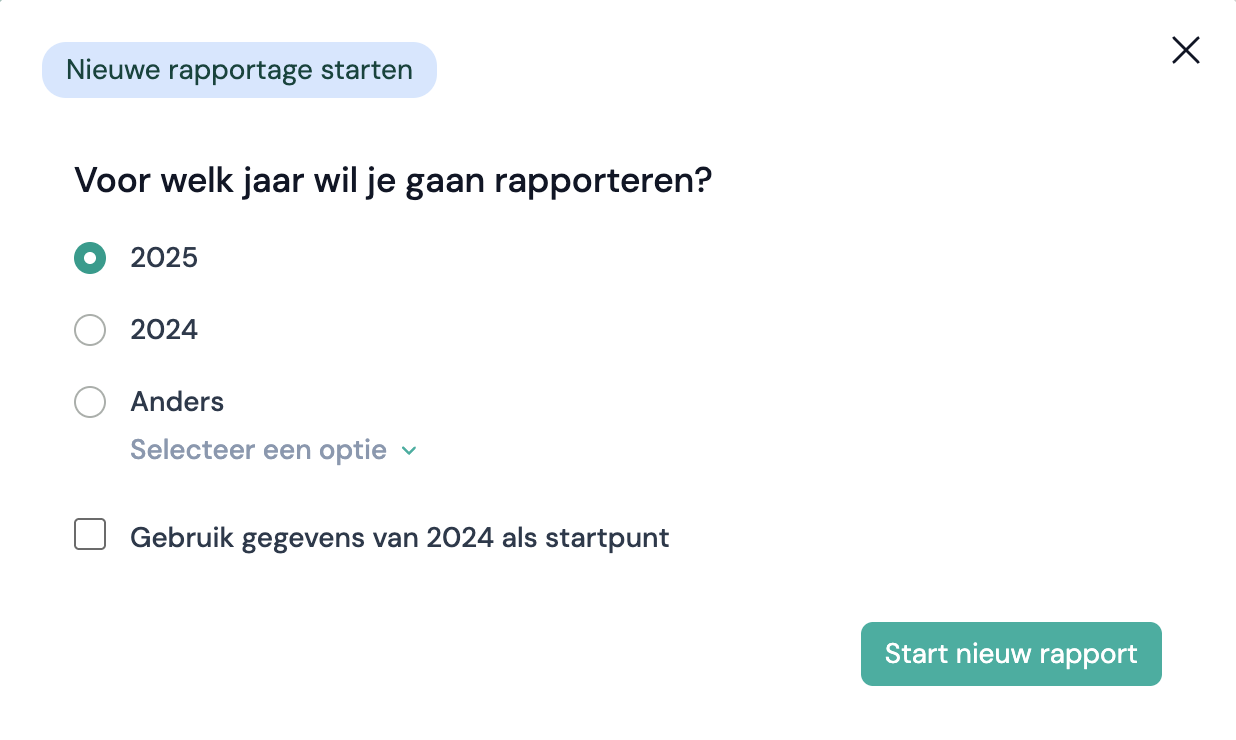
Begin in drie eenvoudige stappen
Zo start simpel je met het berekenen van je CO2-uitstoot en het opbouwen van je VSME-rapport - zonder spreadsheets of voorkennis.
01. Maak een gratis account aan
Je staat in 2 minuten in je dashboard. Geen betaalgegevens nodig, je kunt direct beginnen.
02. Vul je gegevens in
Upload je energierekening of Excel met ritgegevens; de tool herkent alles automatisch en vult de modules voor je in. Je hoeft alleen aan te vullen.
03. Maak je volledige rapport
Bekijk je voortgang, vul ontbrekende onderdelen aan en download je VSME-rapport direct in PDF of Excel.


Veelgestelde vragen
-
Nee. Je kunt direct starten met wat je wél hebt. Ontbrekende gegevens kun je later eenvoudig aanvullen - de tool laat precies zien wat nog nodig is, en de tool geeft ook suggesties waar je dat kan vinden.
-
Nee. Maar steeds meer klanten, ketenpartners en aanbestedingen vragen om VSME-rapportage of vergelijkbare ESG-informatie. Met Greenreporting ben je hier direct op voorbereid. Hier vind je meer informatie, en ook een uitgebreide gids en voorbeeldrapport.
-
Je gegevens worden versleuteld opgeslagen op beveiligde Europese servers. Alleen jij (en eventueel je adviseur) hebben toegang. Geen data wordt gedeeld met derden.
-
Met je basisdata beschikbaar kun je binnen één middag een volledig VSME-rapport en CO2-overzicht downloaden.
-
Ja. Naast het VSME-rapport berekent Greenreporting automatisch je CO2-uitstoot, toont het dashboards per scope en categorie en kun je ESG-doelen instellen en volgen. Je hebt daarmee één plek voor zowel rapportage als inzicht en sturing.
Begin vandaag nog met je eerste rapport
Ervaar zelf hoe eenvoudig het is om met Greenreporting een volledig duurzaamheidsrapport op te stellen. Je kunt direct aan de slag, geen betaalgegevens nodig.
of vraag een rondleiding aan